


Company Overview
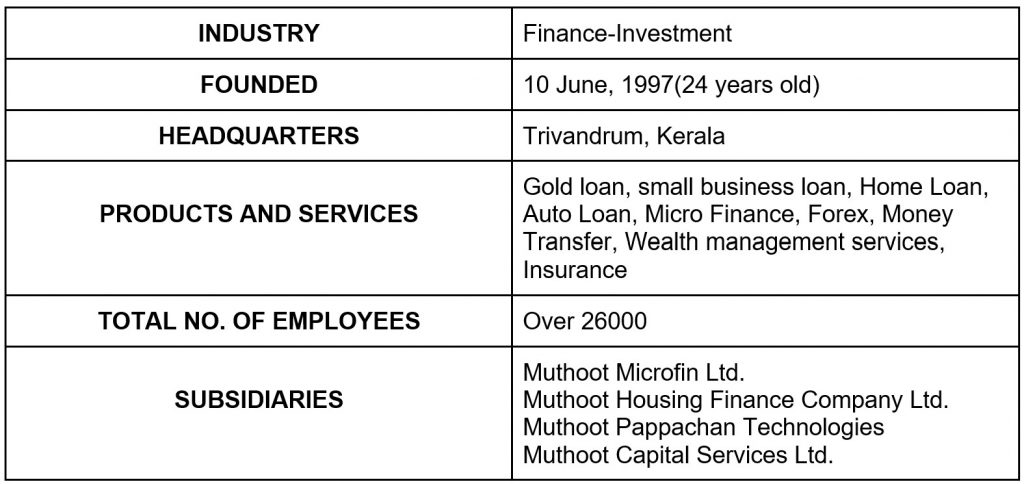
Muthoot Fincorp Ltd.(MFL) is a non-deposit taking, one of the leading NBFCs in the country. The NBFC primarily deals in lending against gold jewelry. It is the flagship company of the Muthoot Pappachan Group also popularly known as the Muthoot Blue Group, which has diverse business interests such as hospitality, real estate, and power generation. The company became the 3rd Largest Gold loan NBFC in India and dispatched Gold loans around (AUM)- 15,883 Cr, 96.3% of the total loan book.
Investing in these bonds can not only help you beat market volatility, but they also ensure monthly payment directly into your bank account.
Invest Now
Capital Structure
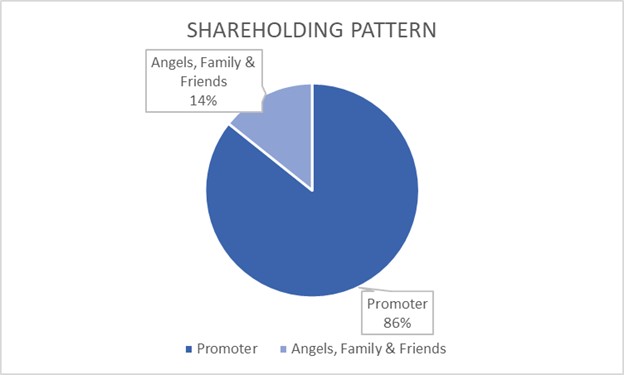
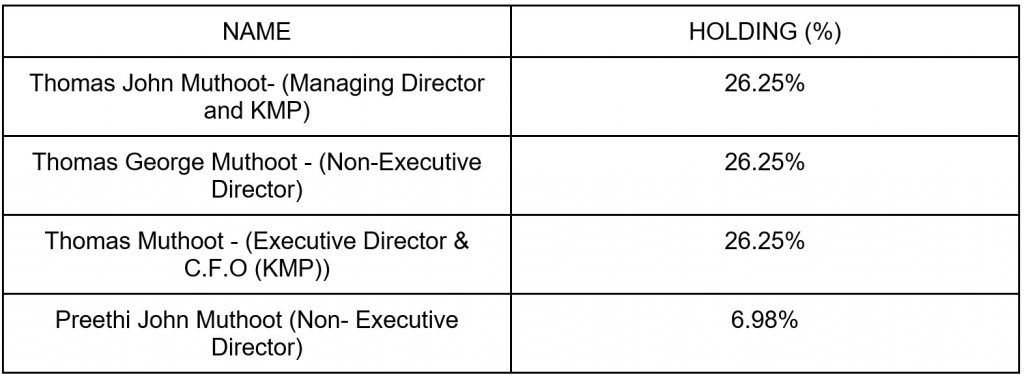
Shareholding of Directors and Key Managerial Personnel
- Issuer has raised Rs. 618 crore via public issue since 2020 (out of which secured borrowings were Rs.1,384 crore and unsecured borrowings were Rs. 234 crore).
- Unsecured borrowings via public issue has been raised at a coupon of 9-9.75% p.a,p.m
Company’s growth statistics
- Serving over 5 million customers.
- Total number of branches across India – 4200+
- Total asset under management – Rs.18,701 Cr
- Credit Cost 0.2%
Financial Overview
The company has had exponential financial growth over the years ever since its inception.
- As on September 30, 2021, the total gold holding stood at 51.40 tonnes (50.59 tonnes as on March 31, 2020). AUM per branch has increased to around Rs.4.51 crore as on September 30, 2021.
- MFLs collection efficiency stands at 97.5% as of March 2021. The company has made a collection of 8000 Cr till Sep 2021 making its liquidity strong. As the company will be able to meet its debt obligations timely.
- Supported by experienced promoters, MFL has established a market position in gold financing.
- The operations of NBFC are geographically constrained. It majorly operated in South India.
- Improvement in asset quality of the non-gold loan segment.
Table 1 showcases the company’s Revenue, Expenses, EBIT (Earnings before interest and taxes) and PAT (Profit After Tax) for the last five years. (In crores)
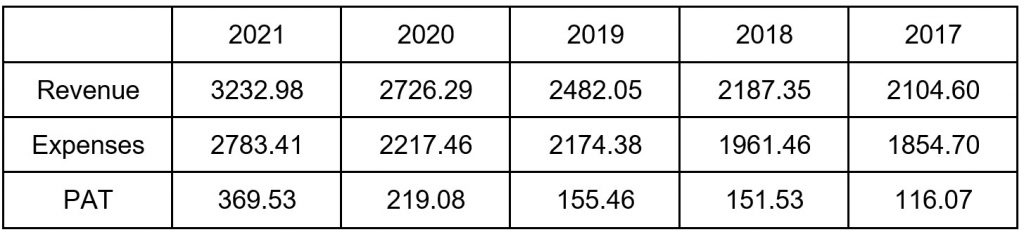
Table2 ,showcases how the company’s cash-in flow has been for the last 5 years.(In crores)
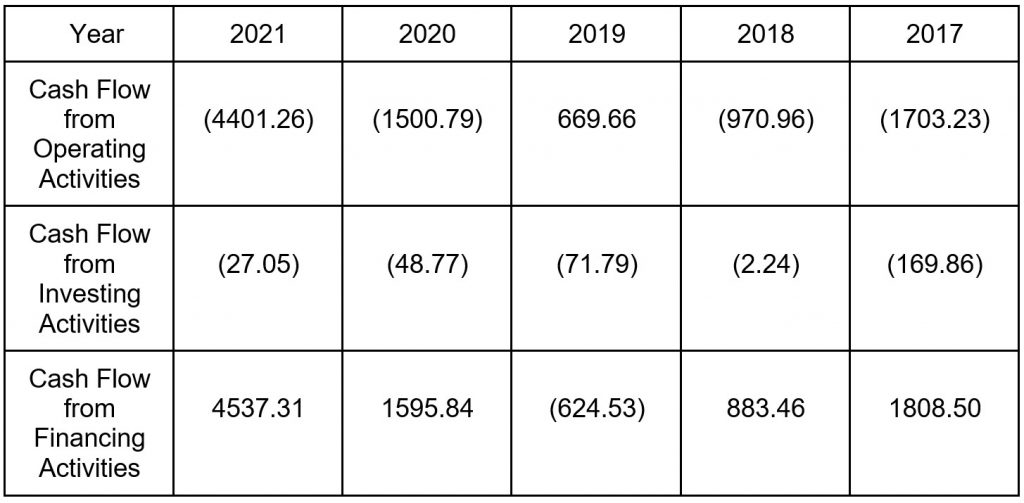
How aforementioned terms have been referred .
- Cash flow refers to the movement of cash in and out of the business at a specific point in time. It represents the net balance of the cash movement.
- Cash flow from operating activities reflects the amount a company generates through its product of services.
- Cash flow from investing activities reflects cash generated and spent relating to investing activities, like purchase of assets, sales of securities etc.
- Cash flow from financing activities gives an insight into the financial stability of a company to its investors. It reflects the net flows of cash that are used to fund the company.
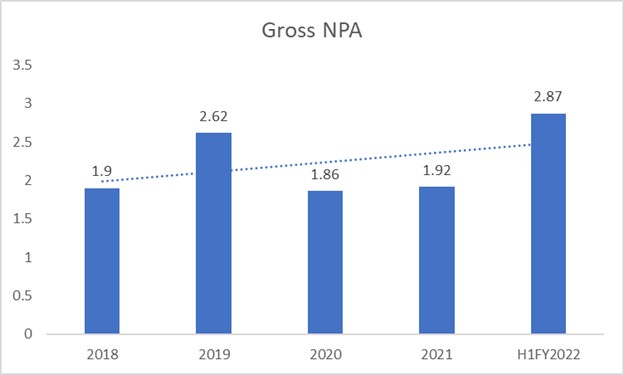
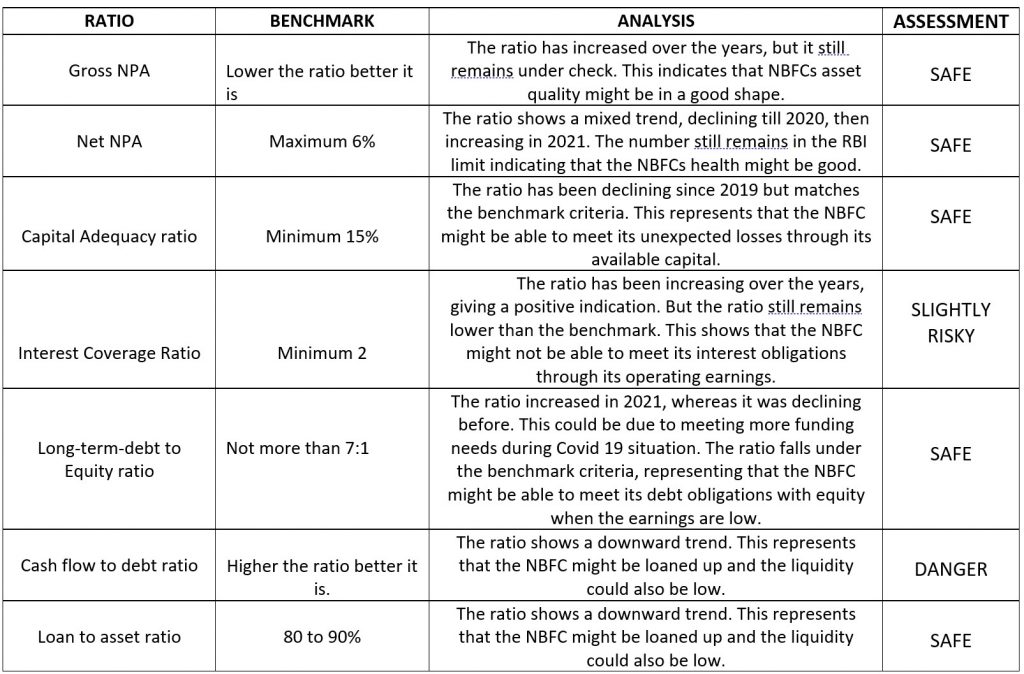
a) Gross Non-Performing assets
It is an absolute number and explains how much of a NBFC’s loans are in danger of not being repaid. A loan turns into a NPA if the interest has not been paid for 3 months. A high GNPA denotes that the NBFCs asset quality is in very poor shape.
Benchmark – Lower the ratio the better it is.
Chart 1 depicts how the Gross NPA performance for the last five years and the ratio ranges from 1.9 to 2.87.
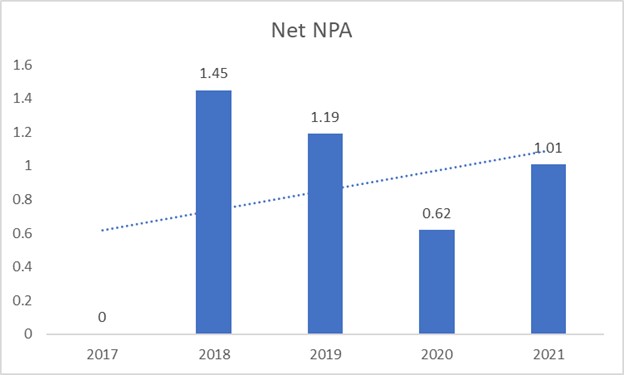
b) Net Non-Performing assets
Net NPA is the subtraction of provisions related to unpaid debt from GNPA. This gives the exact value of bad loans. It is a better indicator of NBFCs’ health.
Benchmark – While there is no universally acknowledged official ‘acceptable’ limit for NPAs, bad loans within 6 per cent are considered manageable. With something above 6% is alarming for RBI.
Chart 2 represents NET NPA performance for the last five years and performance is on the positive side.
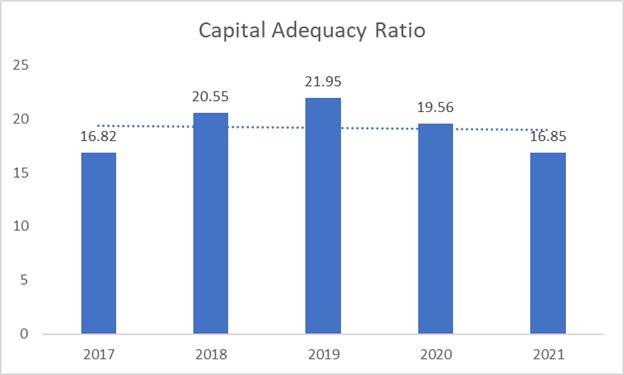
c) Capital adequacy ratio
Capital Adequacy Ratio (CAR) is a measure of the degree to which the company’s capital is available to absorb unexpected loss; high CAR also indicates the ability of the company to undertake additional business.
Benchmark – The norms require all non-deposit taking NBFCs to have a minimum capital adequacy ratio of 15%.
Chart 3 represents Capital Adequacy ratio performance was for the last five years. The performance has consistently been above the required adequacy ratio.
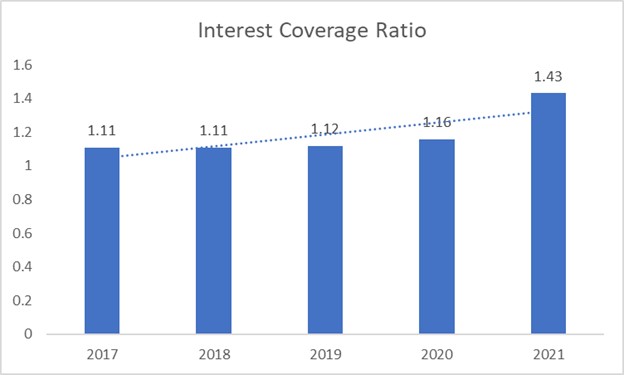
d) Interest Coverage Ratio.
The ratio indicates the power of a firm meeting its interest obligations that arise out of the borrowings made by the corporate within the sort of long-term debt. The lower the interest coverage ratio, the more the company’s debt burden and therefore the greater the likelihood of bankruptcy or default. A far better ratio indicates a better financial health because it means the corporate is more capable of meeting its interest obligations from operating earnings.
How to calculate interest coverage ratio; ICR= EBITDA/INTEREST EXPENSE
Benchmark – Generally, an interest coverage ratio of at least two (2) is considered the minimum acceptable amount for a company that has solid, consistent revenues. Analysts prefer to see a coverage ratio of three (3) or better.
Chart 4 represents interest coverage ratio performance for the last five years. The consistency was below par.
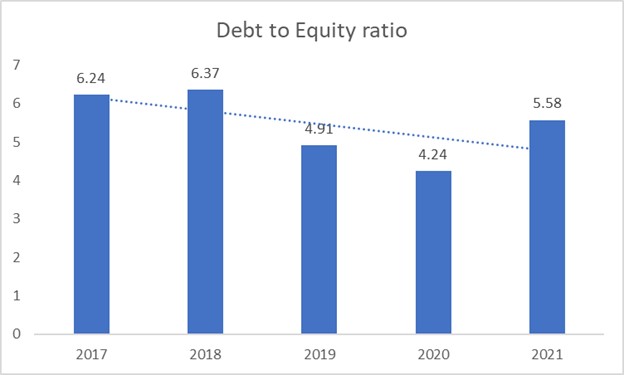
e) Long-Term-Debt to Equity Ratio
Long-Term-Debt-to-Equity ratio reflects the risk appetite of the company. It is an exceedingly important leverage ratio. It explains the ability of a company to make payments associated with long-term debt.
The debt to equity ratio helps ascertain the company’s long-term financial position. A higher debt to equity ratio indicates that more creditor financing (bank loan) is being used in running the business than investor funding (owner’s funds). The fact is that no matter how bad sales/earnings are, every business has to service the debt. When the earnings are low, the owner’s funds can provide a cushion to meet the administration and operational expenses. And also make debt payments at the same time.
Benchmark- Not more than 7:
Chart 5 represents interest Long term debt to equity ratio performance for the last five years.
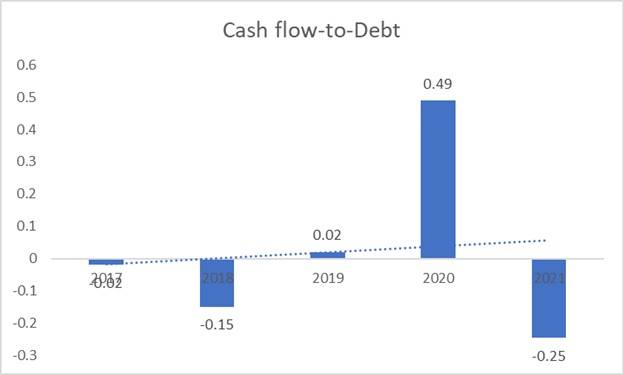
f) Cash flow to Debt ratio
Cash flow to Debt ratio is a coverage ratio. It indicates the time taken by the company to pay off its debt by utilising its operating cash flow.
Benchmark- A high ratio indicates that a company is better able to pay back its debt, and is thus able to take on more debt if necessary.
Chart 6 represents interest cash flow to debt ratio performance for the last five years and has been inconsistent over the years.
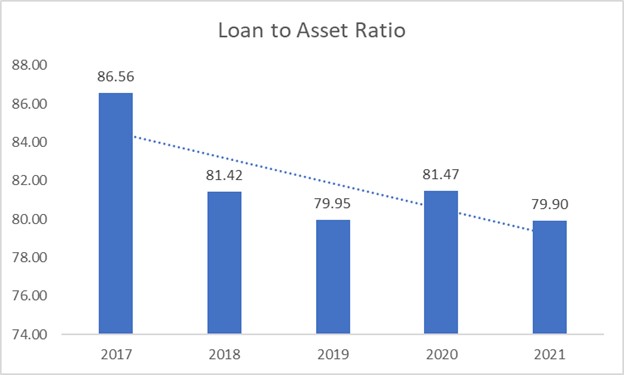
h) Loan to asset ratio
The loan to assets ratio measures the entire loan outstanding as a percentage of total assets. The higher this ratio indicates a NBFC is loaned up, and its liquidity is low. The lower the ratio, the risky a bank could also be to higher defaults.
How to calculate loan to asset ratio; LAR= TOTAL DEBT/TOTAL ASSETS
Benchmark – Typically, the ideal loan-to-deposit ratio is 80% to 90%. A loan-to-deposit ratio of 100% means a NBFC loaned one dollar to customers for every dollar received in deposits it received.
Chart 7 represents a loan to asset ratio performance for the last five years and has been fluctuating over the years.
Ratio Analysis
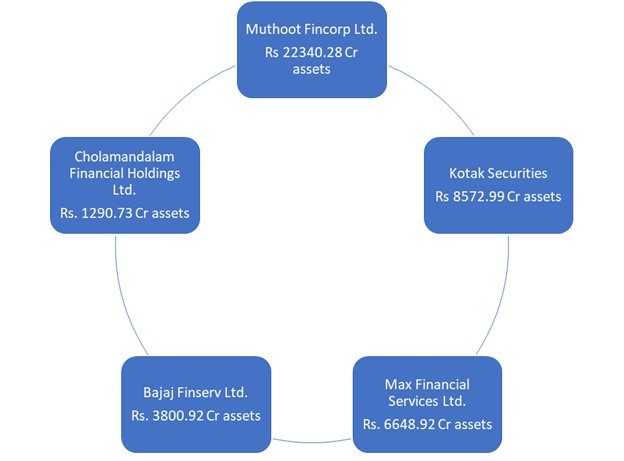
Competitor Analysis
News that trends
- MFL subsidiary plans to open 400 facility centres pan India for providing services such as loans and other financial products.
- Focusing on digital payment segment MFL bought a stake of 54% in Paymatrix, an Hyderabad-based fintech startup.


