
NBFC bonds and NCDs are popular with Indian investors looking for yields above bank fixed deposits, but higher yield comes with higher credit risk. The most direct way to judge that risk is the issuer’s asset quality, and the two numbers you’ll see everywhere are GNPA and NNPA.
Many investors compare them without understanding what separates them. This guide explains GNPA vs. NNPA, how to read them for NBFC bonds in India, and what else to check before you invest.
Start investing with just ₹10K & grow your wealth with fixed return opportunities.
Invest Now

What Are GNPA and NNPA in NBFCs?
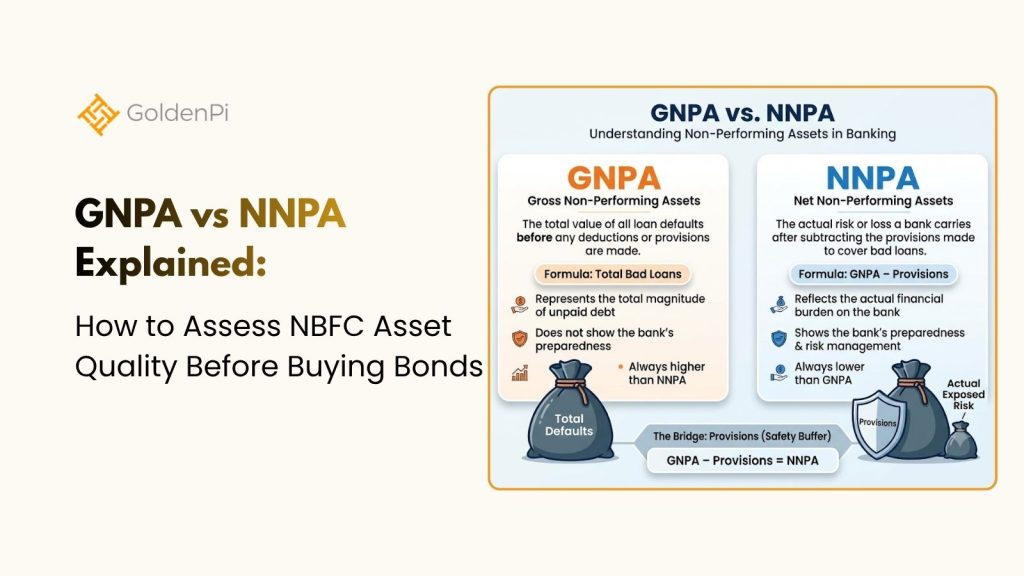
A loan becomes a non-performing asset (NPA) when interest or principal stays unpaid for more than 90 days. Gross NPA (GNPA) is the total value of such loans as a share of the lender’s total loans. It’s the raw measure of bad loans.
Net NPA (NNPA) is what remains after subtracting the provisions the lender has already set aside for those bad loans. In simple terms, GNPA shows how big the problem is, and NNPA shows how much of it the lender hasn’t yet absorbed.
Take an NBFC with ₹100 of loans and a GNPA of 4%. If it has provided for 70% of those bad loans (₹2.8), its NNPA falls to about 1.2%. A second NBFC with the same 4% GNPA but only 30% provisioning would show an NNPA near 2.8%. The headline number is identical, but the second lender is far more exposed.
Why NNPA Matters More for NBFC Bond Investors
Bondholders are repaid from the lender’s earnings and capital. A high NNPA means unprovided losses still sit on the balance sheet, and those can eat into net worth if recoveries disappoint. A rising NNPA, or a widening gap between GNPA and NNPA, deserves attention.
Larger NBFCs that follow Ind AS (the modern accounting standard) report these as Stage 3 and Net Stage 3 assets. The idea is the same, so don’t be thrown by the labels.
GNPA vs. NNPA: Quick Comparison
| Parameter | GNPA | NNPA |
| What it measures | Bad loans as % of total loans | Bad loans after deducting provisions |
| What it tells you | Size of the problem | Unprotected portion of the problem |
| Affected by provisioning? | No | Yes |
| Can it mislead? | If write-offs are heavy | If provisioning is thin |
| Best read with | Provision Coverage Ratio (PCR) | GNPA and capital adequacy |
L(earn) More:
- GNPA vs. NNPA: How to Read Asset Quality Before Buying NBFC Bonds
- Asset-Liability Mismatch in NBFCs: Hidden Liquidity Risks for Bond Investors

- AIS and Form 26AS for Bond Investors: How to Reconcile Coupon TDS

Latest NBFC Asset Quality Trends in India
The sector’s asset-quality indicators remain broadly encouraging. The RBI’s June 2026 Financial Stability Report recorded a GNPA ratio of 2.4% for its sample of 174 NBFCs as of March 2026 [1]. This was lower than the approximately 2.9% reported a year earlier, although differences in sample composition should be considered when comparing the figures. June-quarter FY27 results also pointed to broadly stable asset quality across most NBFCs, according to analysts.
But sector-wide numbers can hide problems at individual lenders. The RBI has raised concerns about growing household debt and the rapid rise in gold loans. Loans against gold jewelry issued by NBFCs grew 69.9% year-on-year to ₹3.29 lakh crore in May 2026 [2].
IIFL Finance shows why this trend needs watching. Its gold loan portfolio grew 90% year-on-year to ₹65,729 crore in September 2026. At the same time, the share of gold loans where borrowers had fallen behind on payments rose to 0.90%, from 0.12% a year earlier. Although this remains below 1%, the increase suggests that missed payments are becoming more common as the business expands.
Higher borrowing costs and further interest rate increases could also put pressure on lenders’ profits, leaving them with less room to absorb losses if more borrowers struggle to repay.
What Else to Check Before Buying NBFC Bonds
A clean NPA ratio can be flattered by write-offs or delayed recognition. Look at:
- Provision Coverage Ratio (PCR): The share of bad loans already provided for. Higher is generally more comfortable.
- Stage 2 assets: Loans that are 30-90 days overdue or showing stress. These are tomorrow’s Stage 3 candidates.
- Write-offs and restructuring: Heavy write-offs can make GNPA look better than reality.
- Capital adequacy ratio (CRAR): The RBI sets a minimum of 15% for most NBFCs, and a comfortable cushion above that absorbs shocks.
- Loan mix: Secured loans like home or vehicle finance behave differently from unsecured or microfinance lending.
- Funding profile: Heavy reliance on short-term or market borrowings can create liquidity stress even when NPAs look fine.
- Credit rating and outlook: Read the rating agency’s rationale (CRISIL, ICRA, CARE, India Ratings), not just the letters.
How to Check NBFC Asset Quality Before You Invest
Start with the issuer’s latest quarterly results or investor presentation, which usually disclose GNPA, NNPA, PCR and Stage 2 numbers. Look at four to six quarters to spot trends instead of relying on one snapshot. Compare the issuer with peers in the same lending segment, not with the sector average. Finally, match the bond’s tenure to how long you can stay invested, since secondary-market liquidity for NBFC bonds can be thin.
GNPA vs. NNPA: Key Takeaways for Bond Investors
GNPA tells you how large the problem is, and NNPA tells you how much of it the lender hasn’t yet cushioned. Neither is enough alone. Read them together with provisioning, capital strength, loan mix and ratings, and you’ll have a clearer view of the risk behind that attractive coupon.
GNPA vs. NNPA FAQs
Gross Non-Performing Assets (GNPA) represent the total value of loans classified as non-performing before deducting provisions for potential losses. The GNPA ratio measures these loans as a percentage of gross advances.
Net Non-Performing Assets (NNPA) reflect non-performing loans after deducting the provisions and other adjustments prescribed for the calculation. The NNPA ratio indicates the remaining NPA exposure relative to the relevant net advances measure.
The GNPA ratio is generally calculated as gross NPAs divided by gross advances, multiplied by 100. The NNPA ratio uses net NPAs divided by net advances, multiplied by 100. Check the issuer’s disclosures for the precise calculation and adjustments used.
GNPA is measured before deducting eligible provisions, while NNPA reflects the effect of those deductions. NNPA is therefore generally lower than GNPA when provisions and other permitted adjustments are positive.
Yes. If an NBFC has recognised substantial provisions against its NPAs, its NNPA can be much lower than its GNPA. Investors should check whether the provisions adequately reflect likely losses and whether the company has the earnings and capital to absorb any additional deterioration.
Check the NBFC’s annual report, quarterly or half-yearly financial results, investor presentations and applicable regulatory disclosures. Look for the reporting date, gross and net NPA amounts, the ratios, provisioning coverage and any explanations of significant movements.
Sources
- RBI — Financial Stability Report, June 2026, Chapter II: Financial Institutions: Soundness and Resilience
- The Economic Times — NBFCs’ gold loans jump nearly 70% in May, fastest across segments: RBI data
Disclaimer
Fixed returns do not constitute guaranteed or assured returns. Investments in corporate debt securities and municipal debt securities/securitized debt instruments are subject to credit risks, market risks, and default risks, including delay and/or default in payment. Read all the offer-related documents carefully. This blog/article should not be construed as financial advice or as an offer or recommendation to buy or sell any security or any products/services of/on GoldenPi or any product/services of its third-party client(s). For a detailed calculation of YTM, visit our website. T&C’s Apply.


