
Adani Airport Holdings Limited is an Adani Group company established to acquire, develop and manage airport infrastructure. Its portfolio includes six airports: Ahmedabad, Lucknow, Mangaluru, Jaipur, Guwahati and Thiruvananthapuram, along with its interests in Mumbai International Airport and Navi Mumbai International Airport.
AAHL raises funds through instruments including non-convertible debentures. NCDs are debt securities that pay interest under specified terms and require principal repayment according to their contractual schedule. An investor’s return depends on the coupon, purchase price, maturity and payment terms.
Airport operators earn revenue from aeronautical activities, such as passenger and aircraft charges, and non-aeronautical activities, including retail, advertising, rentals, cargo and other services. Aeronautical revenue is subject to regulatory frameworks, while non-aeronautical income can help diversify cash flows and improve profitability.
However, airport development is capital-intensive. Expanding terminals and passenger capacity can support future revenue, but construction spending and additional borrowing may put pressure on near-term cash flow. That makes the relationship between operating earnings, debt and repayment capacity central to an NCD investment assessment.
Airport Business Performance: FY24–FY26
Adani Enterprises’ reported Airports segment has grown significantly over the past three financial years.
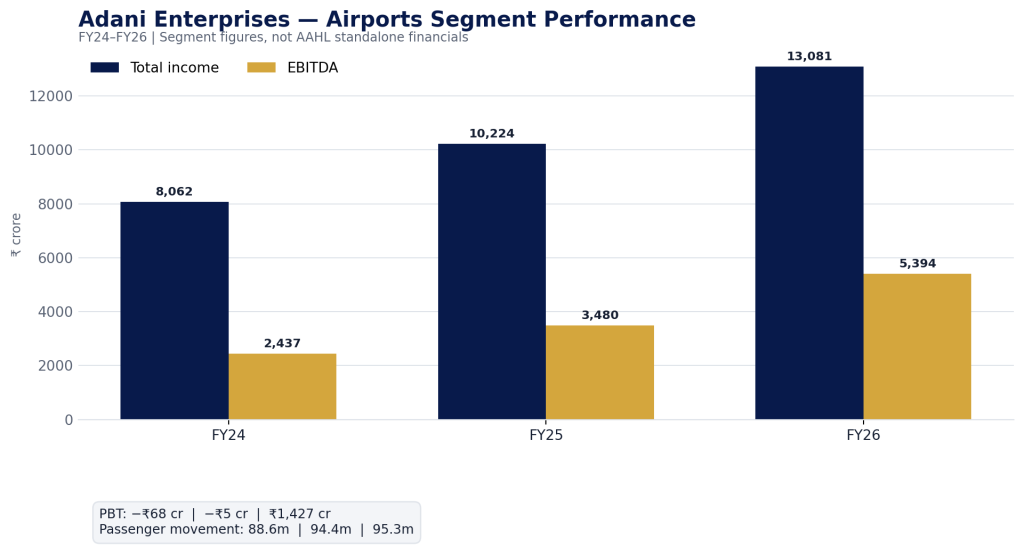
Adani Enterprises’ Airports segment performance, FY24–FY26.
Source: Adani Enterprises FY24, FY25 and FY26 results. Figures are from the reported Airports business segment.
The segment’s total income rose approximately 62% between FY24 and FY26, while EBITDA more than doubled. Profit before tax also moved from a loss in FY24 and FY25 to a positive ₹1,427 crore in FY26. Passenger movements increased more modestly, from 88.6 million to 95.3 million.
The difference between passenger growth and EBITDA growth suggests that revenue mix, tariffs, commercial activity and operating performance matter alongside traffic volumes. In FY26, Adani Enterprises reported growth in both aeronautical and non-aeronautical revenue.
These figures describe the Airports segment reported by Adani Enterprises. They should not be directly combined with AAHL’s separate credit-summary figures or the adjusted financials published by rating agencies, because those datasets have different reporting scopes and accounting definitions.
L(earn) More:
- RBI Sells ₹25,000 Crore of Bonds, Tightens CRR Rules to Drain Excess Bank Liquidity

- Adani Airport Holdings NCDs: Credit Ratings, Yield Spreads, and Balance Sheet Analysis
- Beyond Mutual Funds: The Beginner’s Guide to SIPs in Bonds

Start investing with just ₹10K & grow your wealth with fixed return opportunities.
Invest Now

Credit Rating History: From A+ to AA-
Credit ratings provide an independent assessment of an issuer’s capacity to meet its debt obligations. AAHL’s rating history shows a period of pressure on its outlook in 2023, a return to Stable in 2024 and a CRISIL upgrade in 2025.
| Date | Agency | Rating action |
| January 2022 | CRISIL | A+/Stable |
| March 2023 | CRISIL | A+/Negative |
| January 2024 | CRISIL | A+/Negative reaffirmed |
| August 2024 | CRISIL | A+/Stable |
| August 2025 | CRISIL | Upgraded to AA-/Stable |
| February 2026 | CRISIL | AA-/Stable reaffirmed; proposed ₹2,000 crore NCDs rated |
| July 2026 | India Ratings | IND AA- affirmed; outlook revised to Positive |
| September 2026 | India Ratings | Additional NCDs rated IND AA-/Positive; existing rating affirmed |
Source: CRISIL and India Ratings rating releases. Ratings from separate agencies are shown independently and should not be treated as directly interchangeable.
CRISIL’s March 2023 outlook revision reflected concerns around non-aeronautical revenue and regulatory risk. In August 2024, the agency moved the outlook back to Stable. The August 2025 upgrade to AA-/Stable was driven in part by an improvement in non-aeronautical revenue, which rose from ₹936 crore in FY24 to ₹1,359 crore in FY25 in CRISIL’s assessment.
India Ratings’ July 2026 outlook revision to Positive reflected further growth in non-aeronautical income and the prospect of improved financial flexibility. Its September 2026 release assigned IND AA-/Positive to additional NCDs while affirming the existing rating.
An improved rating can support investor confidence and potentially help an issuer access funding on more favourable terms. It does not eliminate default risk or guarantee a particular market price, yield or investment return.
Balance Sheet and Leverage: A Longer-Term View
The company’s own FY25 credit result summary provides a useful four-year view of its asset base, borrowing and operating earnings.
| Financial metric | FY22 | FY23 | FY24 | FY25 |
| EBITDA | ₹1,484 crore | ₹2,953 crore | ₹3,447 crore | ₹4,350 crore |
| Gross debt | ₹8,487 crore | ₹11,774 crore | ₹13,815 crore | ₹20,163 crore |
| Net debt | ₹7,842 crore | ₹11,000 crore | ₹12,416 crore | ₹19,249 crore |
| Gross assets | ₹21,220 crore | ₹26,155 crore | ₹32,171 crore | ₹42,305 crore |
| Cash balance | ₹646 crore | ₹774 crore | ₹1,399 crore | ₹914 crore |
| Gross assets / net debt | 2.7x | 2.4x | 2.6x | 2.2x |
Source: AAHL FY25 Credit Result Summary. Figures follow the company’s definitions; gross debt excludes Ind AS adjustments and shareholder subordinated debt.
The table reveals two trends. First, AAHL’s EBITDA and gross assets increased substantially between FY22 and FY25, reflecting the expansion and development of the airport business. Second, debt grew alongside that expansion. Net debt increased from ₹7,842 crore in FY22 to ₹19,249 crore in FY25, while cash balances fell from ₹1,399 crore in FY24 to ₹914 crore in FY25.
The gross-assets-to-net-debt ratio also declined from 2.7x in FY22 to 2.2x in FY25. Although this is not a substitute for a formal leverage or debt-service measure, it shows that net debt grew faster than the asset coverage indicated by this particular metric.
These trends make it important to look beyond EBITDA growth alone. Creditors need to assess how much operating cash flow remains available after operating costs, interest, taxes and capital expenditure, and whether liquidity is sufficient to cover scheduled debt payments.
Latest leverage indicators
India Ratings’ July 2026 release reported net leverage (net debt including lease liabilities divided by EBITDA) of 3.1x in FY24, 2.79x in FY25 and 3.30x in FY26 for its rated group. It also reported non-aeronautical revenue of ₹9.36 billion in FY24, ₹13.59 billion in FY25 and ₹22.79 billion in FY26 across the scope specified in its rationale.
The increase in FY26 net leverage, despite higher EBITDA, is a reminder that borrowing and lease liabilities can rise as the business invests. India Ratings expected the growth in non-aeronautical revenue to support a reduction in net leverage below 5.5x in the medium term.
These agency-adjusted ratios should not be compared directly with ratios calculated from AAHL’s credit-summary figures. Their definitions, consolidation scopes and adjustments differ.
Expansion Plans and Debt-Servicing Capacity
AAHL’s growth plans require significant capital expenditure. CRISIL’s February 2026 rationale discussed a proposed outlay of more than ₹25,000 crore over FY26–FY30, including Mumbai International Airport and Navi Mumbai International Airport. It also discussed separate investment plans for the six-airport group. Because these plans cover different scopes, they should not be added together without confirming that the amounts are distinct.
CRISIL estimated debt servicing of approximately ₹600 crore in each of FY26 and FY27, expected to be met through cash flows of around ₹2,100 crore and ₹3,200 crore, respectively. It also referred to approximately ₹14,000 crore of capex during FY26–FY27, funded through internal cash accruals and additional debt. These are agency estimates made in February 2026, not audited actual outcomes for both years.
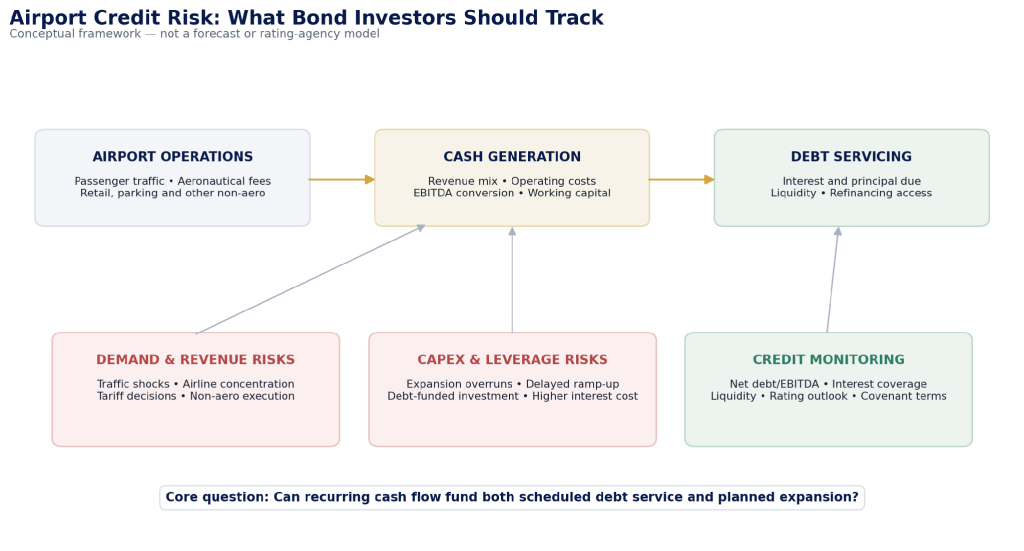
How airport operations, capex and leverage influence credit risk.
The central question is whether the growth in cash generation can keep pace with investment and debt obligations. Investors should consider:
- Debt servicing: Is cash flow sufficient to cover interest and scheduled principal repayments?
- Funding mix: How much capex will be funded by internal accruals, equity or additional borrowing?
- Execution risk: Could construction delays and cost overruns increase funding requirements?
- Regulatory risk: Could tariff decisions or changes affecting non-aeronautical revenue weaken expected cash flows?
- Refinancing risk: Will maturing debt need to be replaced under less favourable market conditions?
Understanding AAHL NCD Yields and Spreads
An NCD’s coupon rate is not the same as its yield to maturity (YTM). The coupon is the stated interest rate, while YTM estimates the annualised return implied by the bond’s market price and contractual cash flows, assuming the investor holds it to maturity and payments are made as scheduled.
Historical trading data illustrates why investors should check the traded price rather than relying on the coupon alone. On 8 October 2026, the CDSL corporate-bond trade repository recorded the following weighted-average yields:
| NCD | Coupon | Maturity | Exchange | Weighted-average traded yield |
| INE0GCN07054 | 8.45% | 12 February 2029 | BSE | 8.7120% |
| INE0GCN07054 | 8.45% | 12 February 2029 | NSE | 8.2573% |
| INE0GCN07062 | 8.96% | 28 September 2029 | BSE | 9.2272% |
| INE0GCN07062 | 8.96% | 28 September 2029 | NSE | 9.0872% |
Source: CDSL Corporate Bond Trade Repository, trades dated 8 October 2026. These are historical observations, not live quotes or assured returns.
The differing yields across exchanges highlight the importance of checking the observation date, traded price, volume and number of transactions. A thinly traded bond may not have a continuously available market price, and the yield observed in an earlier transaction may not be available to an investor placing an order later.
Investors also compare a corporate bond’s YTM with that of a government security of a similar maturity. The difference is called the yield spread:
Yield spread (basis points) = (Corporate bond YTM − comparable government bond yield) × 100
A wider spread can reflect greater perceived credit risk, lower liquidity or other factors. A meaningful comparison requires an appropriately matched benchmark and consistent observation dates. This article does not include a historical yield-spread chart because the available NCD observations do not establish a consistent series around the August 2025 rating upgrade.
NCD yields should therefore be assessed alongside credit ratings, operating performance, leverage, liquidity and future funding commitments rather than treated as a standalone measure of investment quality.
Key Risks Before Investing
Despite the improvement in ratings and reported operating earnings, AAHL NCDs are not risk-free.
- Capital expenditure and leverage: Large investment programmes can increase borrowing and delay the conversion of earnings into cash available for creditors.
- Regulatory risk: Airport tariffs and the treatment of non-aeronautical revenue depend on regulatory decisions. Changes could affect expected returns and cash flows.
- Execution risk: Construction delays, cost overruns or slower-than-expected passenger and commercial growth may weaken financial flexibility.
- Liquidity risk: Listed NCDs may not trade frequently. Investors selling before maturity may have to accept a price below their purchase price.
- Credit and group-related risk: Ratings are assessments, not guarantees. Adverse developments affecting AAHL or the entities within the relevant rated group could affect credit quality.
Before investing, review the specific NCD’s terms, credit rating and outlook, maturity, YTM, traded price, liquidity and your ability to hold the security through its term.
Conclusion
AAHL’s financial history shows a growing airport platform, with higher operating earnings and a larger asset base. It also shows substantial borrowing growth and a decline in cash balances in FY25. The CRISIL upgrade in 2025 and India Ratings’ Positive outlook in 2026 are supportive signals, but they do not remove the risks associated with expansion spending, leverage, regulation and refinancing.
For investors evaluating AAHL NCDs, the key question is whether the yield adequately compensates for the security’s credit, liquidity and maturity risks, given the company’s future funding requirements.
Disclaimer
Fixed returns do not constitute guaranteed or assured returns. Investments in corporate debt securities and municipal debt securities/securitized debt instruments are subject to credit risks, market risks, and default risks, including delay and/or default in payment. Read all the offer-related documents carefully. This blog/article should not be construed as financial advice or as an offer or recommendation to buy or sell any security or any products/services of/on GoldenPi or any product/services of its third-party client(s). For a detailed calculation of YTM, visit our website. T&C’s Apply.


