


")
|
Getting your Trinity Audio player ready...
|
A yield curve is a graphical representation that plots the interest rates or yields of bonds (like Indian Government Securities or G-Secs and corporate bonds) of the same credit quality but varying maturity periods. It provides a visual snapshot of bond market expectations, investor sentiment, and broader macroeconomic conditions in India
The yield curve is one of the strongest, yet often misinterpreted, indicators in financial markets. Besides giving the rate of return, the yield curve is embedded with collective wisdom about future economic growth, inflation levels, and monetary policies. In this article, we look at what the yield curve is all about, its three types and their meanings, why it helps in predicting economic cycles so accurately, how it affects bonds, what makes it different from that of the US in terms of India’s economy, and what message India’s current yield curve sends out in 2026.
What Is a Yield Curve and What Does It Actually Show?
The yield curve is defined as a graph representing the relationship between bond yields plotted against maturity from 91 days (T-Bills) to 40 years (G-Secs). While there are several versions of the same in the international markets, the Indian variant that is mostly followed utilizes G-Sec yields issued by the Reserve Bank of India (RBI) for the entire maturity range.
The yield curve represents much more than just interest rates. The yield curve captures, in essence, how market participants view the prospects for economic growth, inflation, and potential shifts in monetary policy. When investors buy/sell government bonds, they basically cast a vote on the economic situation.
Learning to interpret the yield curve is a very valuable skill indeed for fixed-income investors.
Invest in bonds & earn 9-14%* p.a fixed returns
Start investing with just 10K & grow your wealth with fixed-return bond opportunities.
Explore NowThe Three Shapes of the Yield Curve — and What Each Signals
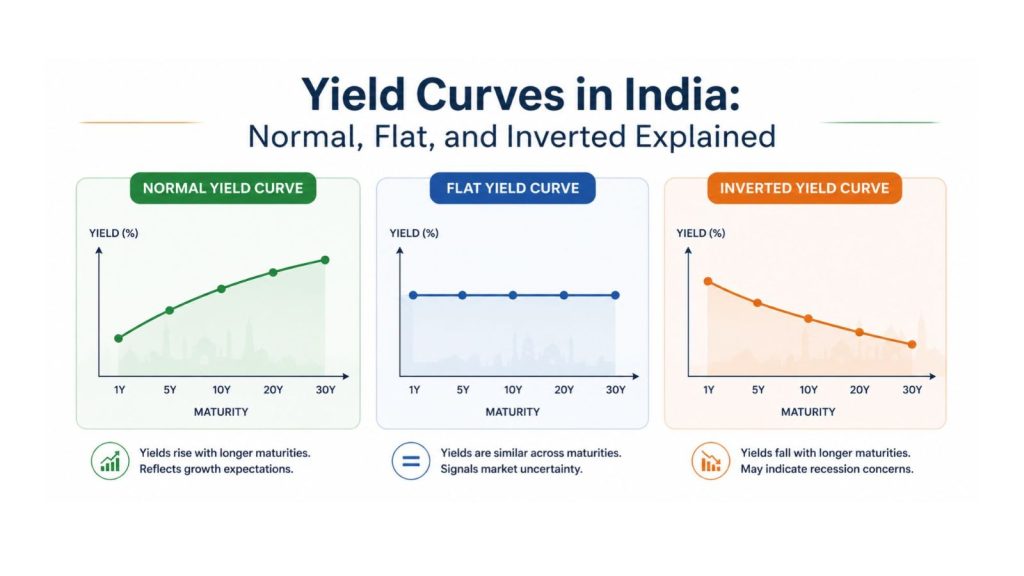
| Shape | What it looks like | What it signals |
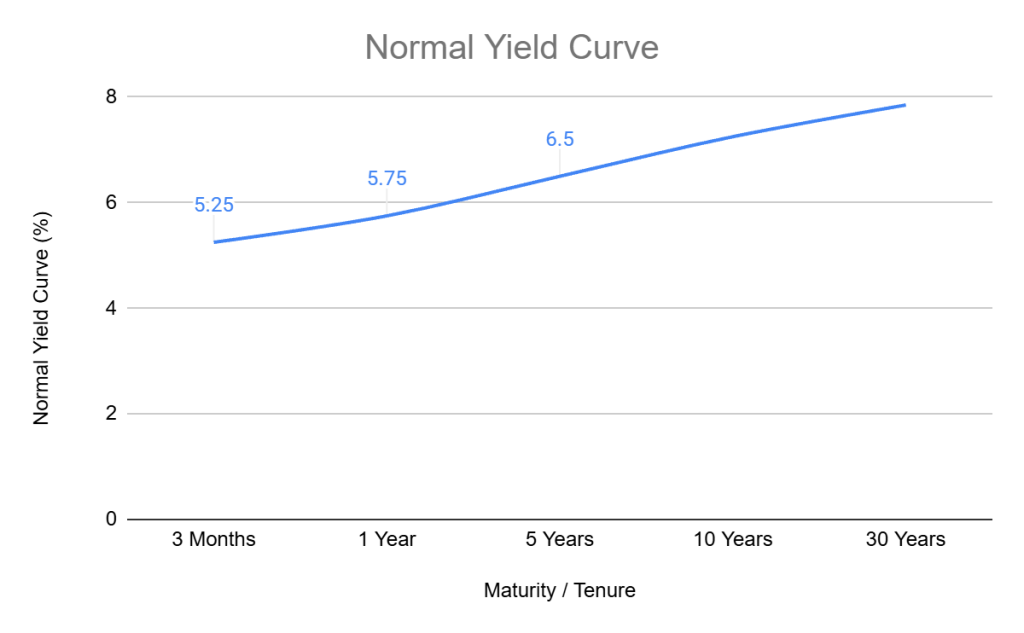
| Normal (Upward Sloping) | Long-term yields higher than short-term | Healthy growth, manageable inflation, optimistic outlook |
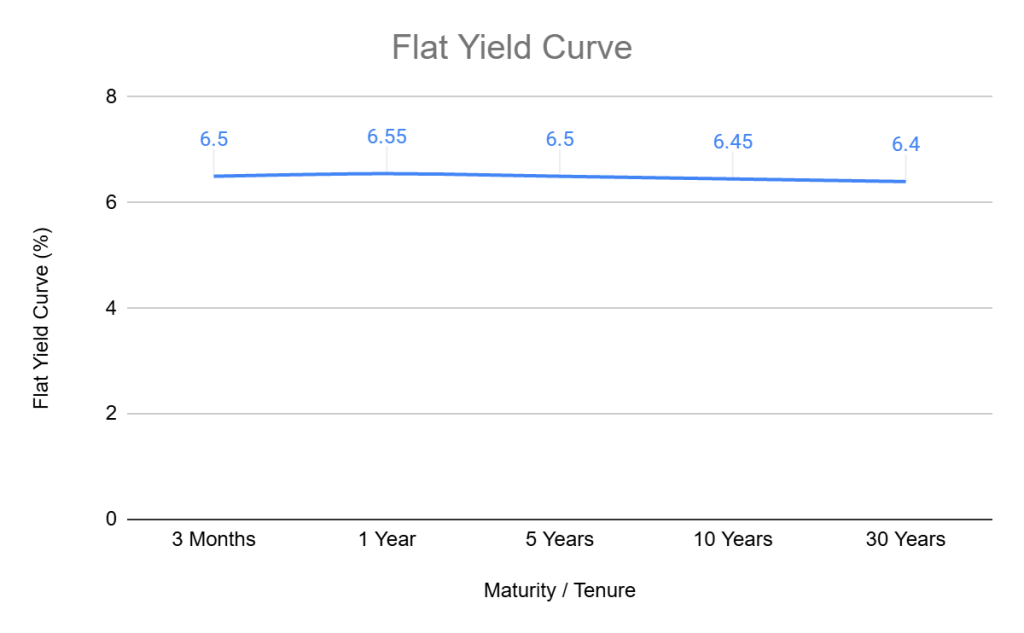
| Flat | Both yields roughly equal | Economic uncertainty, slowing growth, transition state |
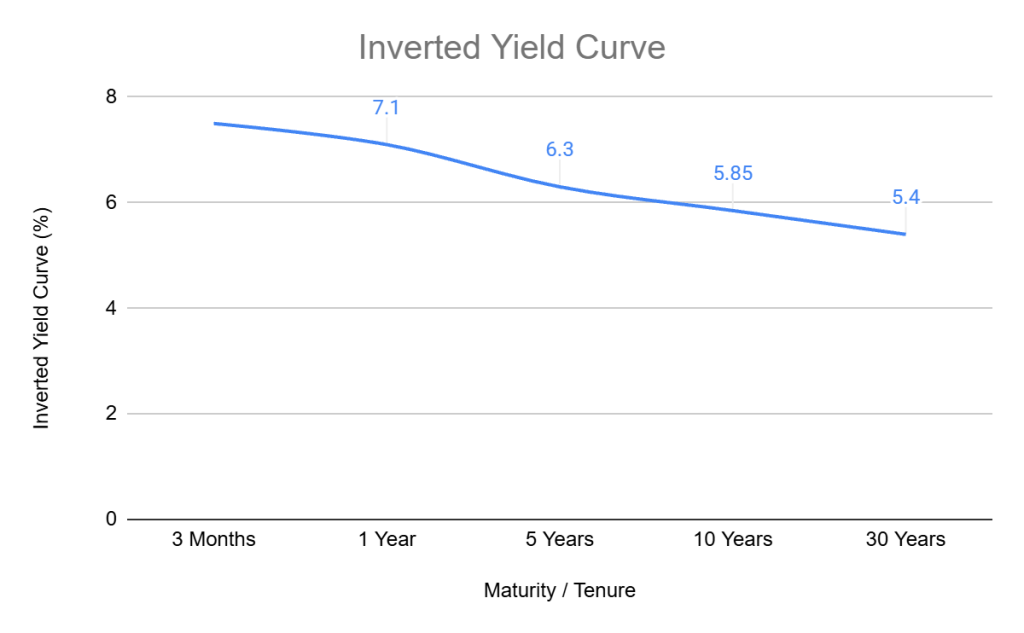
| Inverted (Downward Sloping) | Short-term yields higher than long-term | Recession expected, rate cuts anticipated, economic stress |
Normal Yield Curve
A normal yield curve is the most usual one in a robust economy. Term premiums exist, which are the differences between yields on shorter and longer terms, because there is greater uncertainty in longer periods than in shorter ones. As long as the term premiums make sense, banks can borrow cheaply in short terms and lend at higher rates for longer terms, driving the credit process and economic growth.
Flat Yield Curve
A flat yield curve is an alarm signal. Once there are no differences between short-term and long-term yields, there will be fewer profits for banks on maturity transformation, and lending and credit creation activity will reduce. In such a situation, the economy starts losing momentum.
Inverted Yield Curve
An inverted yield curve is the least desirable shape of all, yet it is the most dependable signal of recessions in historical terms. If the central bank, such as the RBI, decides to raise short-term interest rates drastically to counter inflation, yet investors are confident in the coming recession and thus lower long-term yields, the curve becomes inverted.
Recent Bond News:
- RBI Repo Rate Pause vs Rising G-Sec Yields: What Investors Need to Know
- Why the 10-Year G-Sec Yield Matters to Every Investor

- Understanding Yield Curves in India: Normal, Flat, and Inverted Explained
Why Does the Yield Curve Predict Economic Cycles?
The predictive ability of the yield curve cannot be explained by chance; it is due to a mechanical effect. This effect consists of the bank’s profit and its lending policy.
The banks use short-term financing for long-term loans, which results in high profits when there is a steep normal yield curve. This, of course, encourages banks to lend more and thus stimulates the economy’s growth.
However, the flattening or inverting of the curve reduces banks’ profit opportunities, causing them to stop lending. As a result, companies do not receive loans, leading to less investment and reduced consumer spending. Thus, the shape of the yield curve dictates economic activity with a delay of about 6-18 months.
Hence, the effect of the yield curve on economic development is mechanical rather than passive.
The Key Differences Between India’s Yield Curve and the US Benchmark
The US 2-year/10-year spread is the global yield curve benchmark—tracked by every institutional investor worldwide. However, the Indian yield curve is unique in several aspects:
India’s curve is about 4 percentage points higher than that of other economies—a reflection of India’s higher inflation target and real interest rate than those of the developed markets. This is because India’s yield curve rarely inverts, as deep-rooted differences in economic cycle dynamics and growth potential, along with the RBI’s more active management, result in a structurally steeper curve compared with its western counterparts.
In India, though, periods of flattening, when the difference between short-term and long-term yields narrows, send the same warning as inversions do in the US. It is not just the level of the curve that is important; the direction of the curve is also important.
What Each Yield Curve Shape Means for Different Bond Types
The yield curve is not only a macro signal; it has real-world implications for the performance of various bonds.
In a normal curve environment:
- Long-duration bonds receive a term premium, a reward for long-term investors
- In a healthy economy, corporate spreads tend to be tight.
- In periods of low default risk, high-yield bonds perform well.
In a flattening curve environment:
- No reward for holding on to long-term; short-to-medium term bonds offer similar yields with lesser risk
- As economic momentum takes a hit, high-yield bonds face more pressure
- Floating-rate bonds become more appealing
In an inverted curve environment:
- Short-term bonds offer the best yields
- Long-term bonds may rally sharply if rate cuts follow the inversion
- High-yield bonds face huge pressure
- Dynamic bond funds, which actively vary duration, tend to outperform static assets
India’s Yield Curve in 2026: What It Is Telling Investors
India’s yield curve is telling a story every investor should read.
Since May 2025, 3-year and above G-Sec yields have risen by 20-40 basis points, while long-term bonds (30-40 years) have risen by 35 basis points or more. Meanwhile, the 1-year G-Sec yield has fallen by 5 basis points, driven by the RBI injecting liquidity into the banking system.
The result: India’s yield curve has been steepening. Short-term yields have been falling while long-term yields have witnessed a surge. The yield spread between the 3-year and the 10-year G-Sec widened from 15 bps at the start of FY26 to 48 bps.
The current spread between the 10-year G-Sec yield and the repo rate stands at 96 basis points, suggesting the market is pricing in more risk than historical evidence would suggest. This compression will likely be accomplished through a fall in the 10-year yield rather than a rise in the repo rate—a bond-positive signal for long-term investors, but only if growth and inflation work in favor.
What it means: India’s curve is normal but steepening, reflecting that short-term monetary easing is doing its job, and the long end remains high due to uncertainty over oil, fiscal deficit, and global yields. Not a warning signal, but not a clean all-clear either.
Frequently Asked Questions
A yield curve is a graph that shows the yields of government bonds of varying maturities from 91-day T-Bills to 40-year G-Secs. It shows expectations for economic growth, inflation, and monetary policy. It helps investors decide which segment of the bond market to invest in for the best risk-adjusted returns at a particular point in time.
Historically, an inverted yield curve (short-term yields higher than long-term yields) has been a warning sign of an upcoming recession. India has seen ‘flattening’ rather than ‘inversions,’ which is a result of proactive RBI curve management and a sign of India’s higher growth potential as compared to more developed markets.
A steepening curve, where long-term yields rise relative to short-term yields, rewards investors holding long-duration bonds if they can withstand short-term price volatility. It also signals economic recovery expectations. In India’s 2026 context, the steepening reflects the RBI easing at the short end while long-term uncertainty keeps the long end elevated.
Ready to Invest?
Visit GoldenPi to explore current bond options. Compare yields, ratings, and tenures in one place and invest online with as little as ₹10,000.
Disclaimer:
Fixed returns do not constitute guaranteed or assured returns. Investments in corporate debt securities and municipal debt securities/securitized debt instruments are subject to credit risks, market risks, and default risks, including delay and/or default in payment. Read all the offer-related documents carefully. This blog/article should not be construed as financial advice or as an offer or recommendation to buy or sell any security or any products/services of/on GoldenPi or any product/services of its third-party client(s). For a detailed calculation of YTM, visit our website. T&C’s Apply.


